Sam Pegler
Frameworks Squad
Worked at BritX prior to Ki1, experience in Python and SRE.
Here to talk about application instrumentation, what it is at Ki, how it can be applied to your apps and how it can make everyones lives easier
What is telemetry?
Why do we want observability?
Logging4
A quick example
import logging

log = logging.getLogger(__name__)

def test(potato_type: str) -> None:
    # Using C formatting.
    log.info('Potato type is %r', potato_type)
    # Using `extra` for details.
    log.info('Potato', extra={'type': potato_type})

    # Don't use f strings.
What does the output look like?
{
  "textPayload": "2024-07-11 09:44:44,406 [INFO] app.utils L420: Potato",
  "insertId": "4zjnr6m6t6xlq0lt",
  "httpRequest": {},
  "resource": {
    "type": "k8s_container",
    "labels": {}
  },
  "timestamp": "2024-07-11T09:44:44.406591243Z",
  "severity": "INFO",
  "labels": {
    "python_logger": "app.utils"
  },
  "logName": "projects/potato/logs/stderr",
  "trace": "projects/potato/traces/668fa98882c378faa5fa26bc6d1c03b2",
  "sourceLocation": {
    "file": "/app/main.py",
    "line": "420",
    "function": "test"
  },
  "receiveTimestamp": "2024-07-11T09:44:48.216040101Z",
  "spanId": "f074d13a7f509a84"
}
Metrics5
What do they look like?
# HELP python_gc_objects_collected_total Objects collected during gc
# TYPE python_gc_objects_collected_total counter
python_gc_objects_collected_total 234583.0
Prometheus Example
from observability.decorator import linear_histogram

@linear_histogram(
    metric_name='potato_timer',
    start_bucket=0.1,
    end_bucket=1,  # seconds
    buckets=10
)
def do_something(request: Request):
  ...
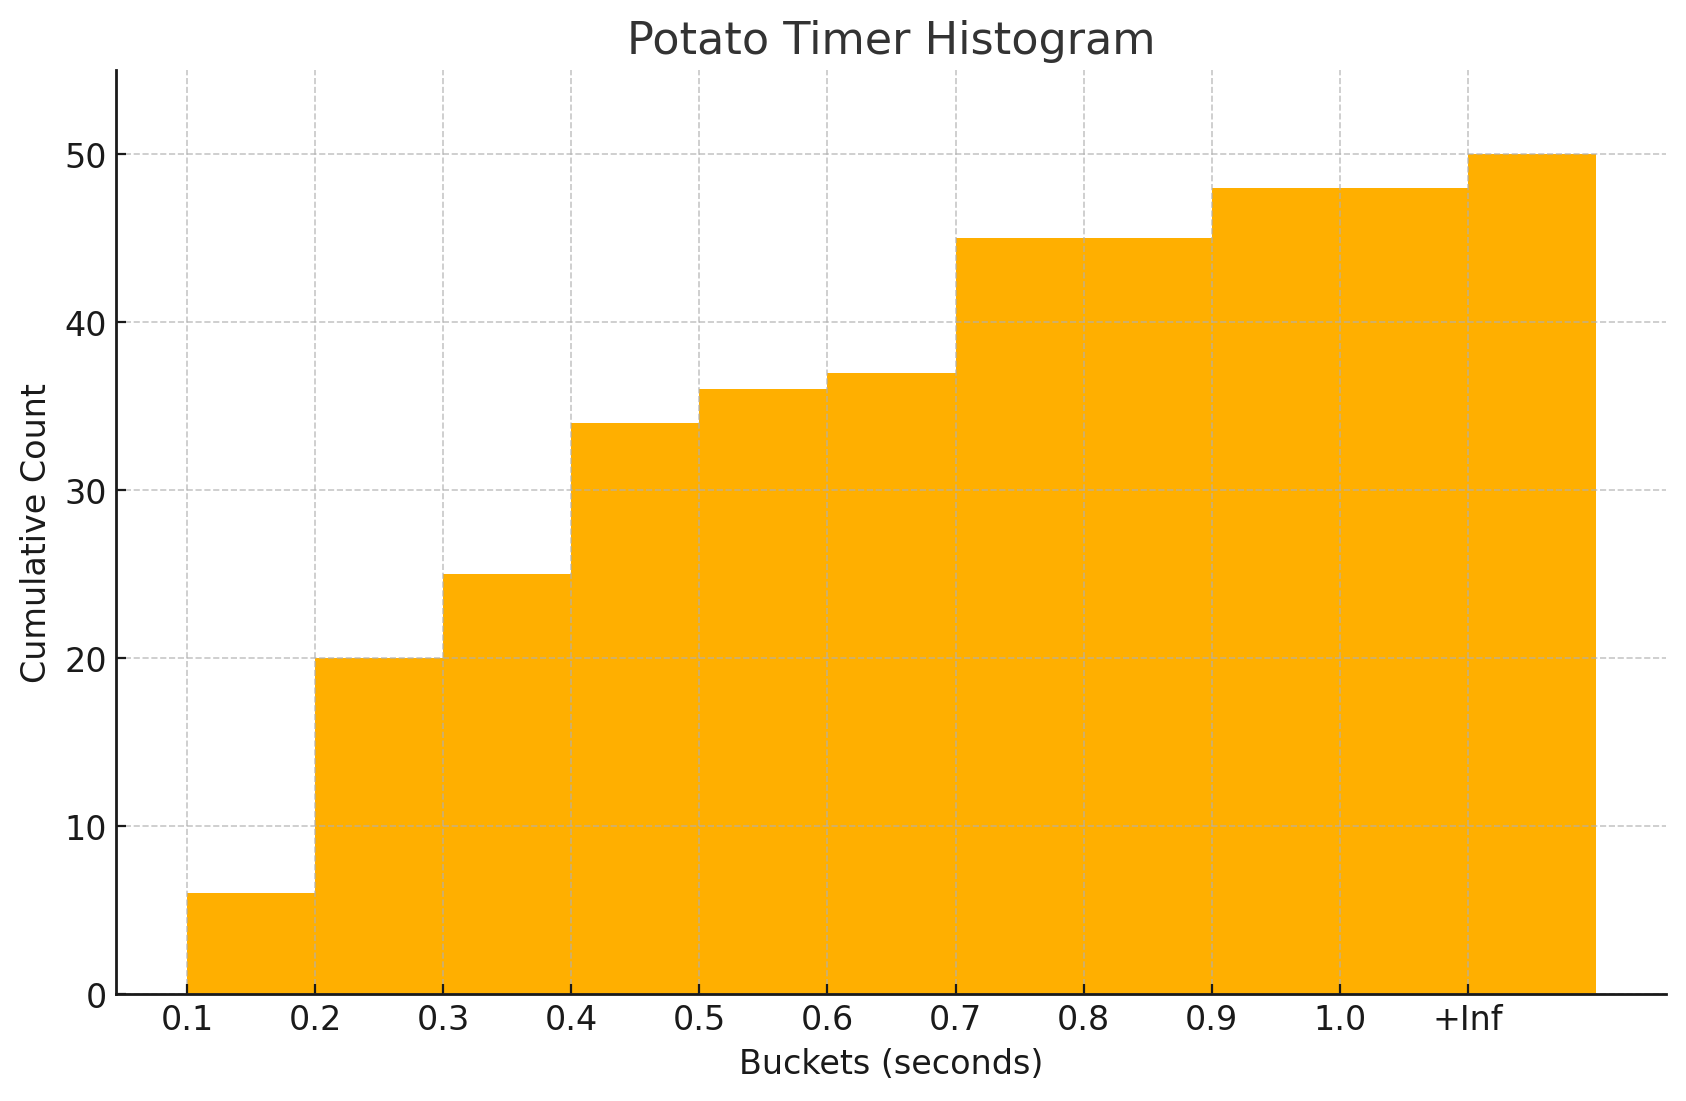
What does that look like?
# HELP potato_timer potato_timer linear histogram
# TYPE potato_timer histogram
potato_timer_bucket{le="0.1"} 6.0
potato_timer_bucket{le="0.2"} 20.0
potato_timer_bucket{le="0.3"} 25.0
potato_timer_bucket{le="0.4"} 34.0
potato_timer_bucket{le="0.5"} 36.0
potato_timer_bucket{le="0.6"} 37.0
potato_timer_bucket{le="0.7"} 45.0
potato_timer_bucket{le="0.8"} 45.0
potato_timer_bucket{le="0.9"} 48.0
potato_timer_bucket{le="1.0"} 48.0
potato_timer_bucket{le="+Inf"} 50.0
potato_timer_count 50.0
potato_timer_sum 18.06633841479197
And it graphed
Tracing
An example graphed trace
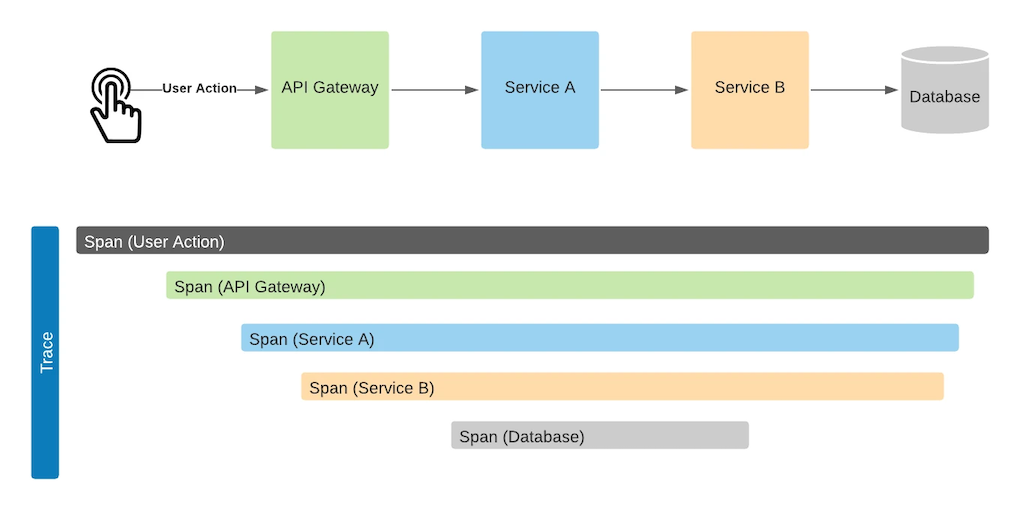
OpenTelemetry Example
import httpx
from opentelemetry import trace

# Creates a new tracer from the global OTEL provider.
tracer = trace.get_tracer(__name__)


def notify_broker_bonus(broker_code: str, broker_name: str, premium: float, brokerage: float) -> bool
    with tracer.start_as_current_span("base") as base_span:
        base_span.set_attributes(
            {
                'broker.code': broker_code,
                'broker.name': broker_name,
                'premium': premium,
                'brokerage': brokerage
            }
        )
        # This will now be tagged with the trace ID for downstream use.
        # This httpx call will create a child span.
        httpx.post(...)
What do they look like?
{
  "name": "base",
  "context": {
    "trace_id": "0x5b8aa5a2d2c872e8321cf37308d69df2",
    "span_id": "0x051581bf3cb55c13"
  },
  "parent_id": null,
  "start_time": "2022-04-29T18:52:58.114201Z",
  "end_time": "2022-04-29T18:52:58.114687Z",
  "attributes": {
    "broker.code": "B1234",
    "broker.name": "Benedict McBroker",
    "premium": "1000000",
    "brokerage": "0.5",
  },
  "events": [
    {
      "name": "Root Span",
      "timestamp": "2022-04-29T18:52:58.114561Z",
      "attributes": {
        "event_attributes": 1
      }
    }
  ]
}
But what about monitoring?
What do we want the end state to look like?
If you want to talk more or even get involved in building this then join #guild-observability
-
Worked on the
otto-corecodebase that is now part of Ki. ↩︎ -
You should read this blog post by Charity Majors, she does a better job of this than I can ever dream to. ↩︎
-
Prometheus metrics spec is short enough to read quickly. If you haven’t read it you should. ↩︎